pyPSG example code
In this tutorial you will learn how to set up a working environment for pyPSG from scratch and run a basic example.
Introduction
This guide walks through installing Python, creating a virtual environment, installing pyPSG, and verifying that everything works correctly.
Installing Python
Step 1: Download Python
Download and install Python 3.10 on your computer or server by visiting the official Python website: Python 3.10.
To verify installation, open a terminal or command prompt and run:
python --version
You should see the installed Python 3.10 version.
Installing MATLAB
Some functionalities of pyPSG require MATLAB (e.g., ECG fiducial detection and HRV computation).
Step 2: Install MATLAB Runtime (R2021a, v9.10)
Follow the guidelines provided in the official MATLAB Runtime documentation:
Make sure to download and install MATLAB Runtime R2021a (version 9.10).
Locating MATLAB Runtime (Windows)
After installation, you will need the path to the MATLAB Runtime directory.
Typical installation location on Windows:
C:\Program Files\MATLAB\MATLAB Runtime\v910
Make sure that the path matches the installed MATLAB Runtime version (R2021a).
Downloading sample data
Step 3: Download sample data
You can download the sample dataset from the following repository:
Environment setup
Step 4: Create and activate a virtual environment
It is recommended to use a virtual environment to avoid dependency conflicts. Create a virtual environment named “pypsg_env” specifically for Python 3.10 using the py launcher:
py -3.10 -m venv pypsg_env
Activate the virtual environment:
pypsg_env\Scripts\activate
Installation
Step 5: Install pyPSG
While the virtual environment is active, install pyPSG using pip:
pip install pyPSG-toolbox
To verify installation, run Python and try importing the package:
import pyPSG
print(pyPSG.__version__)
If no error occurs, the installation was successful.
Running the example code
Step 6: Run example code
Open the Python interpreter:
python
Run the example code, load the example file and check the results:
from pyPSG.pypsg_example import pypsg_example
pypsg_example(channels = {"ppg": "Pleth", "ecg": "EKG", "spo2": "SpO2"})
When running the example without specifying paths, the following dialogs will appear:
First, you will be prompted to select the EDF file.
Then, you will be prompted to select the MATLAB Runtime directory.
Notes:
The channel names (
"Pleth","EKG","SpO2") correspond to the provided sample dataset.If you use your own data, you must update the channel names to match the labels in your EDF file.
Channel names are case-sensitive and must exactly match those stored in the file.
Step 7:Exit the Python Interpreter and Deactivate the Virtual Environment
To exit the Python interpreter, type:
exit()
Deactivate the virtual environment:
deactivate
You have successfully installed pyPSG, executed the example code, and explored the results. Feel free to customize and use pyPSG for your projects.
Output files
During the execution of the example, several output files are generated and saved into the temp_dir directory.
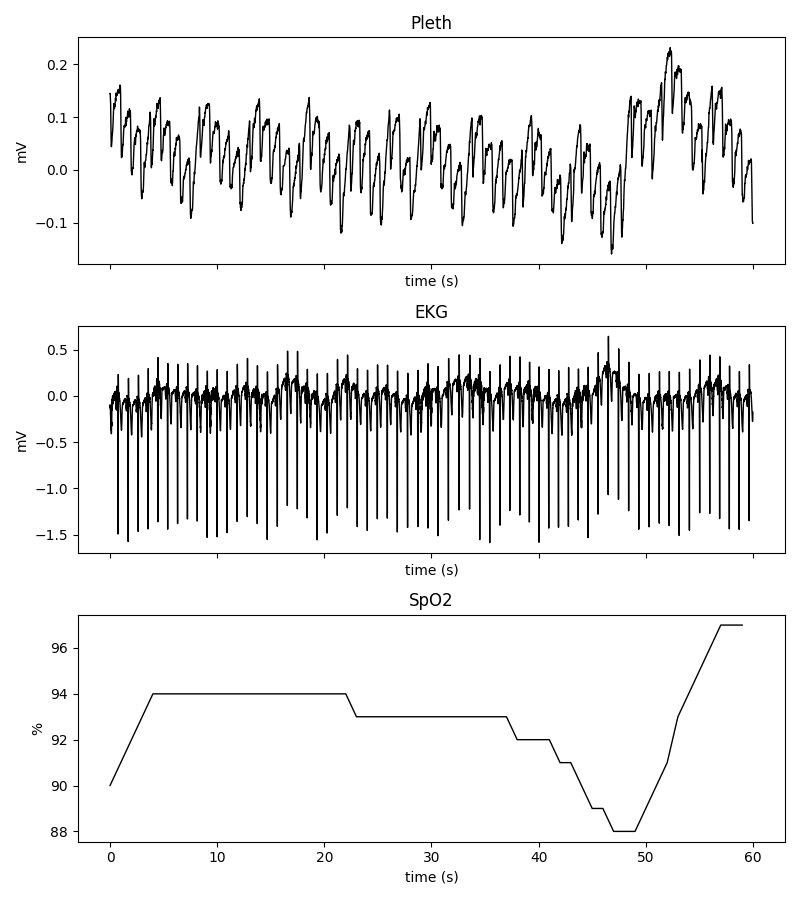
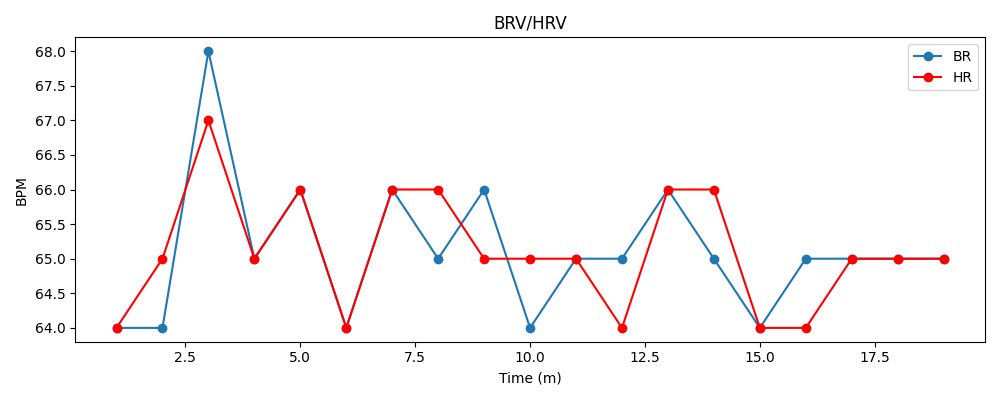
Raw signal and variability plots
The toolbox generates visualisations of the loaded physiological signals and the computed BRV/HRV trends.
Exported CSV files
The extracted biomarker statistics are automatically exported into CSV files for further analysis.
The following files are generated:
spo2_summary.csvSummary table of the extracted SpO₂ biomarkers.ppg_stats.csvStatistical summary of PPG biomarkers and derived ratios.brv_summary.csvStatistical summary of Beat Rate Variability (BRV) biomarkers.hrv_summary.csvStatistical summary of Heart Rate Variability (HRV) biomarkers.ecg_summary.csvStatistical summary of ECG interval and waveform biomarkers.
The CSV files can be directly opened in spreadsheet software such as Microsoft Excel or imported into data analysis libraries such as Pandas.
MATLAB export
In addition to the CSV files, all extracted biomarkers are also saved into a MATLAB .mat file:
temp_dir/biomarkers.mat
This file preserves the complete nested biomarker structure and can be loaded directly in MATLAB or SciPy.